
AMILAN™ Nylon Resin Properties of CM3001G-30 Mechanical properties

Tensile properties
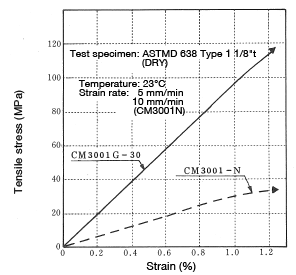 Figure 1-1: Tensile stress-strain curve
(Minute-strain region)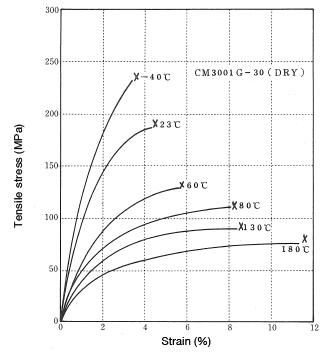 Figure 1-2: Tensile stress-strain curve
(Effects of temperature)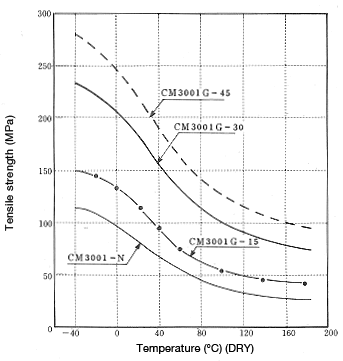
Figure 1-3: Change in tensile strength as a function of temperature
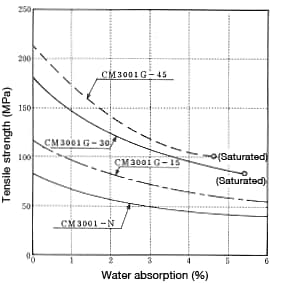 Figure 1-4: Change in tensile strength resulting from water absorption
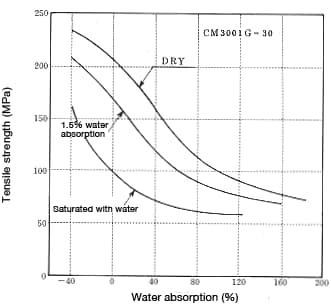 Figure 1-5: Change in tensile strength in products with water uptake as a function of temperature
Flexural properties
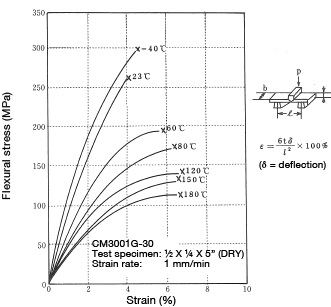 Figure 1-6: Flexural stress-strain curve
(Effects of temperature)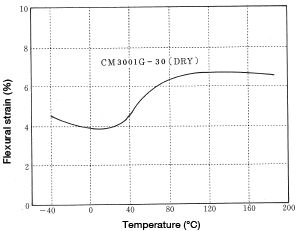 Figure 1-7: Change in flexural strain as a function of temperature
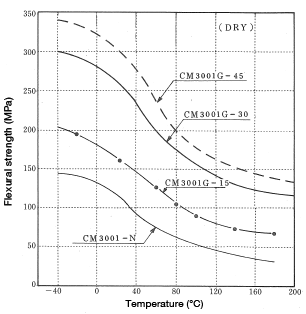 Figure 1-8: Change in flexural strength as a function of temperature
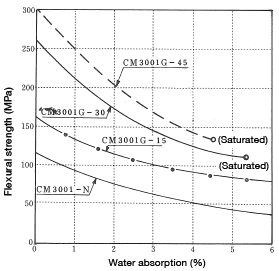 Figure 1-9: Change in flexural strength resulting from water absorption
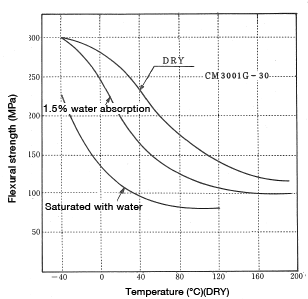 Figure 1-10: Change in flexural strength in products with water uptake as a function of temperature
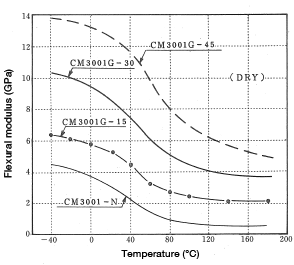 Figure 1-11: Change in flexural modulus as a function of temperature
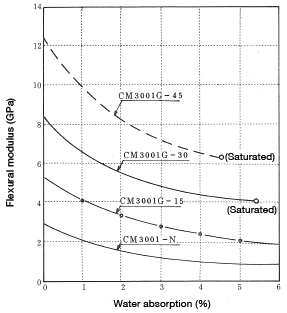 Figure 1-12: Change in flexural modulus resulting from water absorption
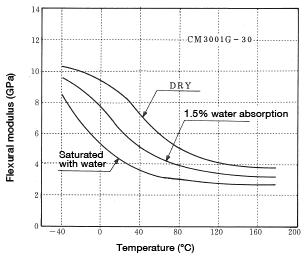 Figure 1-13: Change in flexural modulus in products with water uptake as a function of temperature
Compressive properties
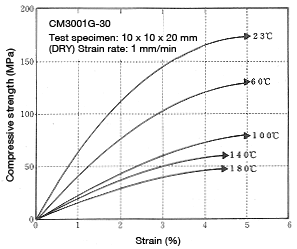 Figure 1-14: Compressive stress-strain curve
(Effects of temperature)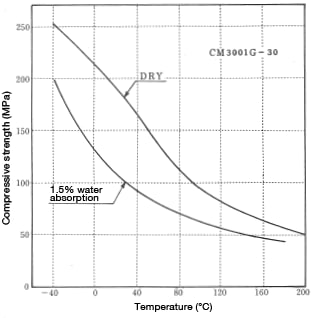 Figure 1-15: Change in compressive strength in products with water uptake as a function of temperature
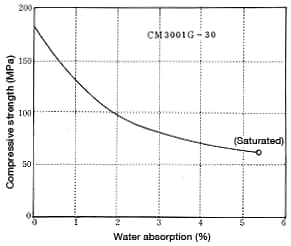
Figure 1-16: Change in compressive strength resulting from water absorption
Shearing properties
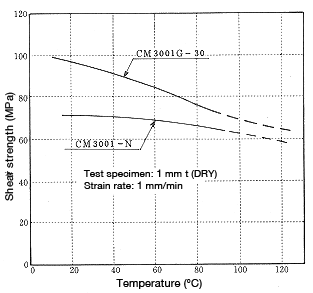 Figure 1-17: Change in shear strength as a function of temperature
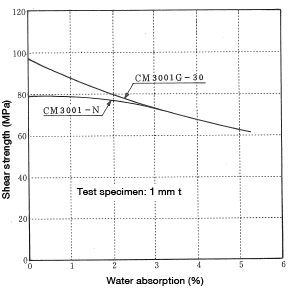 Figure 1-18: Change in shear strength resulting from water absorption
Impact properties
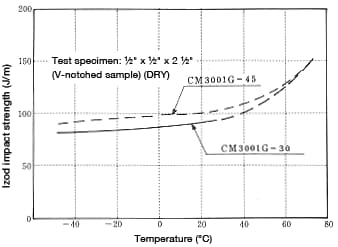 Figure 1-19: Change in impact strength (using a V-notched sample) as a function of temperature
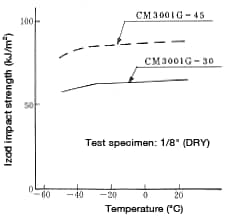 Figure 1-20: Change in impact strength(using an unnotched sample) as a function of temperature
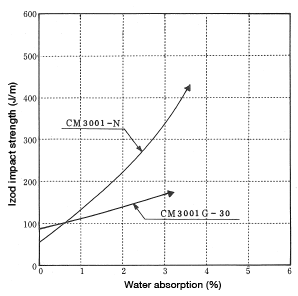 Figure 1-21: Change in impact strength (using a V-notched sample) resulting from water absorption
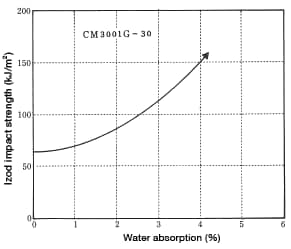 Figure 1-22: Change in impact strength (using an unnotched sample) resulting from water absorption
Surface hardness properties
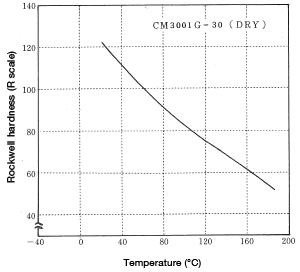 Figure 1-23: Change in Rockwell hardness as a function of temperature
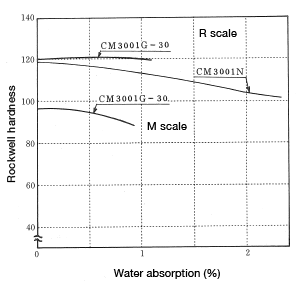 Figure 1-24: Change in Rockwell hardness resulting from water absorption
Friction and wear properties
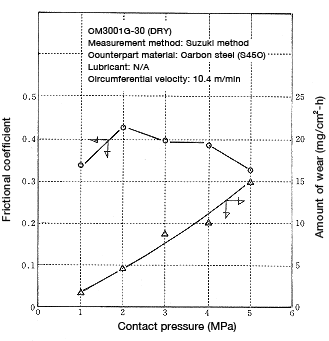
Figure 1-25: Change in frictional coefficient and amount of wear as a function of contact pressure
Other properties
| Category | Unit | Measurement direction | |
|---|---|---|---|
| Machine direction | Transverse direction | ||
| Tensile strength | MPa | 132 | 117 |
| Flexural strength | MPa | 235 | 165 |
| Flexural modulus | GPa | 7.8 | 5.1 |
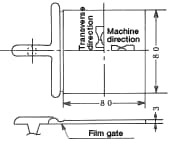
Test specimen: Cut out from a square plate (shown in figure below) and fraise milled.
- Tensile test specimen: ASTM D-1822 S-type tensile impact test specimen
- Flexural test specimen: 14 × 80 × 3t
| Category | Unit | Weld strength | Normal strength |
|---|---|---|---|
| Tensile strength | MPa | 83 | 180 |
| Elongation | % | 1.9 | 5 |
| Flexural strength | MPa | 131 | 260 |
| Flexural modulus | GPa | 6.8 | 8.5 |
| Impact strength (using unnotched sample) |
kJ/m2 | 8 | 65 |
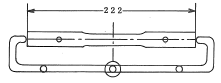
Test specimen: Typical weld on a 1/8" thick ASTM No. 1 dumbbell, where resin collides with resin at the center of a test specimen having gates at both ends.
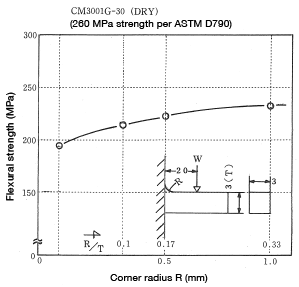 Figure 1-26: Change in flexural strength as a function of corner radius (R)
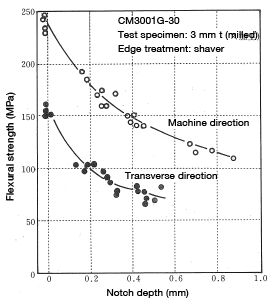 Figure 1-27: Change in flexural strength as a function of sharp edges (Cross-section surface area not corrected
Jun 07,2024